Week of April 27, 2026

Published every Monday: Get a detailed snapshot of what moved the markets last week—and what to watch this week.

Kevin Warsh’s path to Fed chair clears.

The S&P 500 and Nasdaq Composite closed at record highs last week amid Middle East conflict and testimony from Kevin Warsh, nominee for chair of the Federal Reserve (Fed). Fixed income markets were weaker. Treasury yields moved higher, with the 10-year closing at 4.31 percent.

Weekly Quick Hits

Beyond the Headlines

Kevin Warsh’s path to Fed chair clears.

Report Releases

Despite depressed consumer sentiment, retail sales beat expectations in March.

Financial Market Data

The S&P 500 and Nasdaq Composite reached record highs; the Russell 2000 rallied.

Looking Ahead

The Fed’s rate decision headlines a busy week for data and earnings.

BEYOND THE HEADLINES:

Kevin Warsh’s Path to Fed Chair Clears

Kevin Warsh, the Fed chair nominee, testified before the Senate Banking Committee on Tuesday as the first step in the confirmation process. On Friday, the path forward became clearer.

Senator Thom Tillis, a Republican from North Carolina and a key vote to move the nomination out of committee, had declined to support advancing the nomination until the Department of Justice (DOJ) concluded its investigation involving current Fed Chair Jerome Powell. On Friday, the DOJ closed that investigation. Over the weekend, Tillis said he would vote for Warsh. Warsh could be approved in time to lead the next Fed meeting in June.

How Would Warsh Differ from Powell?
Warsh reassured investors about how he intends to lead the central bank. His testimony emphasized support for Fed independence and his role in protecting it. He also made no promises about the next move on interest rates.

Warsh differs from Powell in terms of the size of the Fed’s balance sheet, how it measures inflation, and how it sets policy. He views inflation in terms of its impact on spending power and returns. He has indicated he would place less emphasis on economic models and less on forward guidance in setting interest rate policy. But the biggest difference may be his view of the Fed’s balance sheet. He has expressed concern that using the balance sheet shifts from setting monetary policy to establishing fiscal policy; instead, he argues for shrinking the balance sheet over time. He thinks the Fed’s expanded balance sheet has benefited asset prices while causing higher inflation.

Many investors came away from that testimony feeling that, in the short term, Warsh would be a steady hand who would be unlikely to make dramatic changes. The central bank is likely to continue to be data-driven in setting policy over the next several months as the impact of higher oil prices works its way through inflation data.

What Could It Mean for Markets?
If Warsh is successful in implementing his views, it could lead to more market volatility. A reluctance to use the Fed’s balance sheet as it has been used in the past could lead the central bank to tolerate more market volatility without stepping in to provide increased liquidity.

In his first term with the Fed, during the 2008 financial crisis, Warsh earned the reputation of being hawkish on inflation. His views on the central bank’s role could be beneficial for consumers; if inflation falls, purchasing power could improve over time.

The Bottom Line
Warsh represents a shift away from the “easy-money” central banking policies of the past two decades. Warsh would move the Fed toward restraint and discipline in its approach to monetary policy. That could lead to fewer policy safety nets and more market volatility. If successful, that shift could support stronger purchasing power over the long term.


“The Fed is likely to countinue to be data-driven in setting policy over the next several months as the impact of higher oil prices works its way through inflation data.

Report Releases: April 20– 24, 2026

Retail Sales

Retail Sales:
March (Monday)

Retail sales beat expectations last month due to better-than-expected core sales growth. Figures from January and February were also revised higher. Consumers are showing strength so far this year.

  • Expected/prior month retail sales monthly change: +1.4%/+0.7%
  • Actual retail sales monthly change: +1.7%
University of Michigan Consumer Sentiment

University of Michigan Consumer Sentiment Survey:
April (Friday)

The ceasefire in the Middle East helped consumer sentiment improve slightly from its preliminary April level. The final reading is near a comparable level to the low from June 2022, when inflation was spiking.

  • Expected/prior month sentiment: 48.5/53.3
  • Actual month sentiment: 49.8
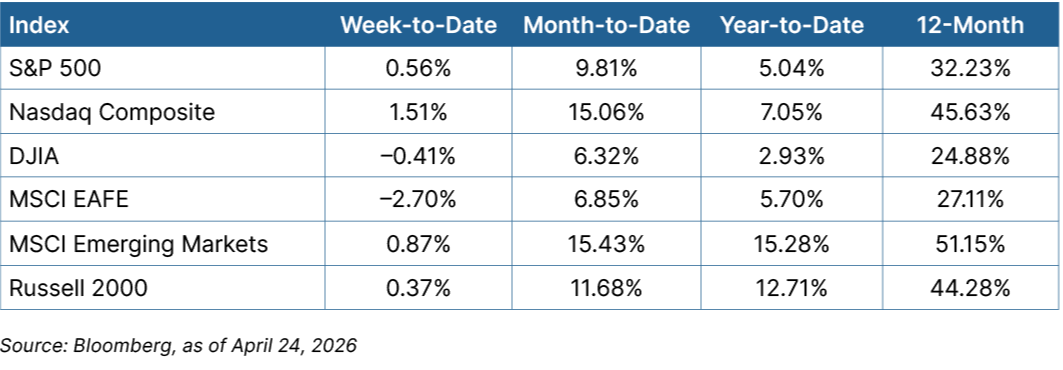

The Takeaway


  • Retail sales beat expectations, and figures from previous months were revised higher.
  • The University of Michigan consumer sentiment survey rebounded slightly from historic lows, continuing a pattern where depressed sentiment has not affected spending.  

Financial Market Data

Equity

Markets were mostly higher, with the S&P 500 and Nasdaq Composite ending the week at record highs. The Russell 2000 was higher for the fifth consecutive week. The rally was concentrated, however; the Dow Jones Industrial Average and the equal-weight S&P 500 were down. Energy and technology each rose roughly 3 percent. Health care fell 3 percent, and financials and real estate dipped more than 1 percent. International markets were mixed; developed markets declined and emerging markets rose.
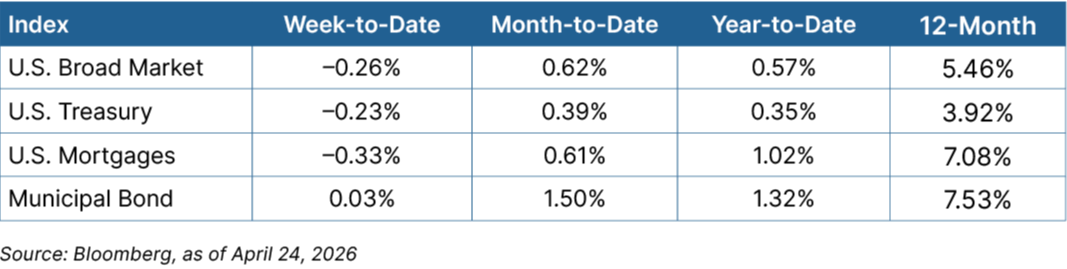
Equity Graph

Fixed Income

Fixed income markets were weaker in response to higher oil prices and the Fed chair nominee’s testimony about the path of interest rates. Yields moved higher across the Treasury curve, with the 10-year closing at 4.31 percent. High-yield also declined, and the municipal bond market was flat.

Fixed Income graph

The Takeaway


  • The S&P 500 and Nasdaq Composite closed at all-time highs. The equal-weight S&P 500 declined.
  • Fixed income markets were weaker as Treasury yields moved higher.
Looking Ahead Image

Looking Ahead

Investors await the Federal Open Market Committee’s (FOMC’s) decision on interest rates after its April meeting, with a particular focus on the Fed chair’s comments afterward.

  • The week kicks off Tuesday with an update on the Conference Board Consumer Confidence Index for April. It’s expected to fall after rising modestly in March.
  • On Wednesday, we await the FOMC decision on interest rates. Economists and markets expect the rate to remain unchanged as the Fed continues to be data-dependent. for April.
  • On Thursday, we’ll see the advance estimate of first-quarter GDP. Economic growth is expected to rebound from the fourth quarter, with 2.1 percent annualized growth.
  • Finally, it will be another big week for earnings reports from major companies, including Alphabet, Amazon, Apple, Meta Platforms, and Microsoft.

Disclosure: This material is intended for informational/educational purposes only and should not be construed as investment advice, a solicitation, or a recommendation to buy or sell any security or investment product. Investments are subject to risk including loss of principal. Some investments are not suitable for all investors and there is no guarantee that any investing goal would be met. Please contact your financial professional for more information specific to your situation.

Certain sections of this commentary contain forward-looking statements based on our reasonable expectations, estimates, projections, and assumptions. These views are subject to change at any time. Forward-looking statements are not guarantees of future performance and involve certain risks and uncertainties, which are difficult to predict. Past performance is not indicative of future results. Diversification does not assure a profit or protect against loss in declining markets. All indices are unmanaged, and investors cannot invest directly into an index. Unlike investments, indices do not incur management fees, charges or expenses.

Definitions: The Dow Jones Industrial Average is a price-weighted average of 30 actively traded blue-chip stocks. The S&P 500 Index is a broad-based measurement of changes in stock market conditions based on the average performance of 500 widely held common stocks. The Nasdaq Composite Index measures the performance of all issues listed in the Nasdaq Stock Market, except for rights, warrants, units, and convertible debentures. The MSCI EAFE Index is a float-adjusted market capitalization index designed to measure developed market equity performance, excluding the U.S. and Canada. The MSCI Emerging Markets Index is a market capitalization-weighted index composed of companies representative of the market structure of 26 emerging market countries in Europe, Latin America, and the Pacific Basin. It excludes closed markets and those shares in otherwise free markets that are not purchasable by foreigners. The Bloomberg Aggregate Bond Index is an unmanaged market value-weighted index representing securities that are SEC-registered, taxable, and dollar-denominated. It covers the U.S. investment-grade fixed-rate bond market, with index components for a combination of the Bloomberg government and corporate securities, mortgage-backed pass-through securities, and asset-backed securities. The Bloomberg U.S. Corporate High Yield Index covers the USD-denominated, non-investment-grade, fixed-rate, taxable corporate bond market. Securities are classified as high yield if the middle rating of Moody’s, Fitch, and S&P is Ba1/BB+/BB+ or below. One basis point (bp) is equal to 1/100th of 1 percent, or 0.01 percent.

Authored by the Investment Research team at Commonwealth Financial Network®.

© 2026 Commonwealth Financial Network®

Let’s Talk About Your Financial Future

Whether you’re navigating a volatile market or preparing for the future, we’re here to help.

Schedule a Consultation